Load over Time Statistics
(Pro Version)

Home > Quickstart > Load over Time Statistics


Load over Time Statistics(Pro Version) |
|
|
Home > Quickstart > Load over Time Statistics |
|
|
|
The Network Load over Time Statistics display the network load per address, network card, protocol, connection, or a combination of these over a configurable period of time. You choose between different chart types to display the data (see Load over Time Charts for more details). The resulting charts can be saved to disk or copied to the clipboard. To create a new Load
over Time Statistics View, click the New Load over Time Statistics
button |
|
|
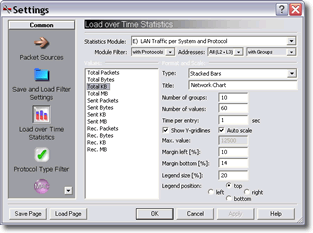
Open the Load over Time Statistics Settings page of the Settings dialog. As for the standard statistics you can use the other pages in the dialog to configure filters that will restrict the packets that are evaluated for the statistics display. This works in the same way as the capture filter for collecting packets and is described in detail later on.
You can choose between different statistics modules to analyze different aspects of the network traffic. A detailed description of the different modules can be found on the Statistics Modules page. Click the Statistics Module combo box and select the 'Internet Traffic A<->B with Protocol (Basic)' in group F) (if you switched off the Easy Statistics Mode, this module is called 'L3 Addr between L3 Addr Higher Protocol Statistics'). Now select 'Total KB' in the values list on the left, select the Stacked Bars chart type, set the number of values to 40 or 50, and the time per entry to 1 second. Then click OK to create a new Load over Time Statistics View. |
|
|
If the statistics collection did not start automatically (see Auto-Start
Collection option in the Tools
Menu), you can start it now by clicking the Start button
|
|
|
Click the Stop button |
|
|
You can copy the chart as enhanced metafile to the clipboard. Therefore
click the copy button Note: While many applications can import enhanced metafiles, you will often not get the same formatting as on the screen. Sometimes it can help to change the width or height of the chart after pasting it into an application (especially if only some legend labels do overlap). If this does not help, you may need to save the chart as bitmap file (see below) and then import this file into the application. |
|
|
To save the chart to disk, click the Save button
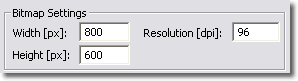
If you selected a bitmap format, you can configure the size (in pixels) and the resolution (in dpi) of the bitmap with the controls at the bottom of the dialog. Please note that greater values for the resolution will increase the (pixel) size of the fonts. This may lead to overlapping text if the bitmap size is too small. |
Now you may want to collect some packets from the network into the packet list view. This is described on the next page. Or you can learn more about generating network traffic reports in the Advanced Features section.
![]()

 in the toolbar, use the File > New Load over Time
Statistics menu command, or press Ctrl+H on the keyboard. This will open
the
in the toolbar, use the File > New Load over Time
Statistics menu command, or press Ctrl+H on the keyboard. This will open
the 

 in the toolbar, or you use the Collect > Start menu command,
or press F8 on the keyboard. If there is any traffic on your network,
you should see some bars moving to the left that display the connections
(with the used protocols) that currently cause the most network traffic.
in the toolbar, or you use the Collect > Start menu command,
or press F8 on the keyboard. If there is any traffic on your network,
you should see some bars moving to the left that display the connections
(with the used protocols) that currently cause the most network traffic.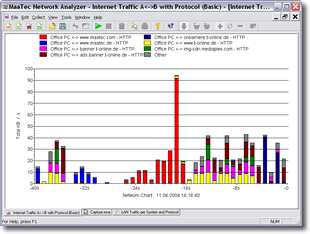

 , use the Collect > Stop menu
command, or press Ctrl+F8 on the keyboard to freeze the current statistics
display. Though you needn't stop the statistics to save or copy the chart.
, use the Collect > Stop menu
command, or press Ctrl+F8 on the keyboard to freeze the current statistics
display. Though you needn't stop the statistics to save or copy the chart.
 , use the Edit > Copy menu command,
or press Ctrl+C or Ctrl+Insert on the keyboard.
, use the Edit > Copy menu command,
or press Ctrl+C or Ctrl+Insert on the keyboard.
 , use
the File > Save or Save As menu command, or press Ctrl+S on the keyboard.
Under file type you can choose between four different bitmap formats and
the enhanced metafile vector format. The recommended format is PNG 8 bit,
as this will create the smallest files. You should use the BMP format
only if your target application does not support the PNG format (which
should rarely happen).
, use
the File > Save or Save As menu command, or press Ctrl+S on the keyboard.
Under file type you can choose between four different bitmap formats and
the enhanced metafile vector format. The recommended format is PNG 8 bit,
as this will create the smallest files. You should use the BMP format
only if your target application does not support the PNG format (which
should rarely happen).