Network Troubleshooting
If your network is troubled, you can use a conventional protocol analyzer
or network sniffer to find the source of your problem. But in many cases it
will be more convenient to get a quick overview of what is happening in the
network. Therefore the MaaTec Network Analyzer offers its real-time statistics
component. You can use it to find the system that causes the most network traffic
and congests the LAN or the server that causes the least network traffic, maybe
due to a CPU overload. Or you can analyze the percentage of network bandwidth
that each system and/or protocol consumes in your LAN.
To help you troubleshooting a network, the Network Analyzer offers a large
number of different statistics, and you can configure many aspect of the statistics
view. As this may look a bit complex at first sight, you will find a short configuration
guide here, followed by some usage examples with tips for the best network statistics
module to use.
Network Statistics Configuration
You can use the New button in the Packet Sources/Sinks window
or the 'New Statistics' command in the File menu to start a new real-time statistics
session. This
opens the Settings dialog that is used by every component of the Network Analyzer.
You can set here different filters or network cards that shall be used when
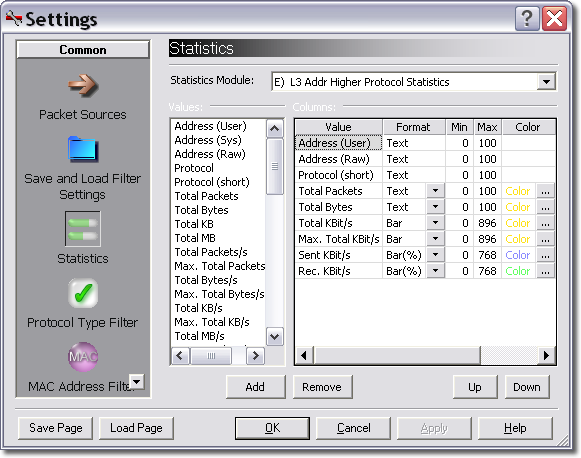
collecting statistics data. But the most important settings page is the statistics
page that allows you to select the statistics module and to configure the columns
that will be visible in the statistics window.
 |
 |
First select a module, e.g. 'Internet Traffic per System and
Protocol' (or 'L3 Addr Higher Protocol Statistics' if the 'Easy Statistics
Mode' was disabled in the Tools menu). This module will display the traffic
caused by different systems in your network together with the protocol that
was used. Now you can select the columns you want to see and configure their
format. Use the Add button or double-click items in the 'Values' list to move
them to the 'Columns' list. Every row in the 'Columns' list corresponds to one
column in the statistics window as shown below.
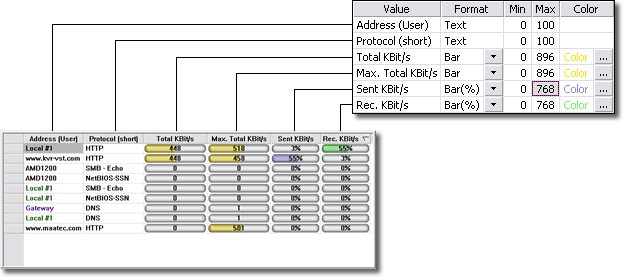
You can choose between text or a bar graph format for most values. If you
want to use bar graphs you need to configure the maximum value for that column.
Otherwise the application won't know which bar size to display for different
values. If currently small fonts are used for the list display, which is the
default, you should use the Small Bar format. The normal bars are larger and
can be used with font sizes of 10 point and more.
If you are satisfied with your settings, click OK and start the data
collection. The MaaTec Network Analyzer will remember your settings for every
statistics module. But you can also save your settings to disk or into the
Quick Load list of the settings dialog. While statistics are collected you
can change the sorting of the displayed data by clicking the column headers.
The view is updated two times per second and displays the average values of
the last two seconds. You can also open additional windows via the Window menu
to see the same statistics with different sorting or you can open other statistics
or protocol analyzer windows at the same time. Internally the Network Analyzer
application uses highly cache optimized data structures and sorting algorithms,
thus the CPU will not be overly stressed.
Statistics Modules Overview
The modules are assigned to six functional groups A to F. Group
A contains only one module for network interface statistics. This will simply
display the total traffic volume for every network card in your system. Group B
contains two modules for address statistics. It can display the total, received,
and sent traffic for every system (or better for every address) in your network.
Usually an address corresponds to a single computer system.
LAN (L2) and Internet (L3) addresses
Many statistics modules can display statistics for LAN (L2 addresses) or internet
traffic (L3 addresses). The 'L' stands for a network layer as defined in the OSI
standards. Layer 2 addresses are the MAC addresses of your network hardware, while
addresses that are defined by network protocols are usually layer 3 addresses (e.g.
IP-, IPX-, or NSAP-addresses). The difference is that Layer 2 addresses are only
valid and visible inside the local network (LAN), while layer 3 addresses are used
to identify systems in the whole internet. Hence internet (L3 address) statistics
will give you many more details about the systems that communicate together, while
LAN (L2 address) statistics can be used to find the gateways in your LAN that are
used to transmit packets to other LANs or the internet.
Back to the statistics modules: Group C contains modules for directed traffic
statistics. These display the traffic that is sent from one address to another
address (A-->B) or between two addresses (A<->B). If you are using
the A-->B modules, you will usually find two entries in the statistics window
for data connections between two computers, one for each direction. Group D contains
modules for protocol statistics that will show the traffic that is generated
by different protocols in your LAN. Group E contains modules that combine address
and protocol statistics. With these modules you can see the traffic that is caused
by every computer in your network together with the protocol that is used (e.g.
PC XY uses 80% of your internet bandwidth by loading data via the Kazaa protocol).
Finally group F contains modules that combine the directed traffic and protocol
statistics. They show the traffic on different connections in the network together
with the used protocol. If you switched off the 'Easy Statistics Mode', the
protocol statistics modules offer even more detail options than the address
modules, so what does Lx or Higher Protocol mean.
L2, L3, L4, Higher, and Highest Protocol Options
As above the 'L' stands for layer. Communication between computer systems involves
different tasks (e.g. name resolution, routing, data fragmentation) that are
defined by different standards and processed by using different network protocols.
Often one protocol uses another protocol for for further data processing (e.g.
HTTP data is sent inside TCP packets, these are wrapped into IP packets, and
these are transported to a neighbor system inside an ethernet frame). Thus we
get a protocol stack with different layers for different tasks. The Higher and
Highest Protocol options will display the protocol that was used on top of the
stack, which is usually the one you want to see. The difference between these
two is that the Higher Protocol option will show the base protocol (e.g. SMB),
while the Highest Protocol option will further subdivide some protocols (e.g.
SMB into SMB - Transaction, SMB - Negotiate, etc.). So why do you need the other
options? Some higher protocols can use different protocols on the lower layers.
For example the SMB protocol can use either the NetBIOS over TCP/IP or IBM NetBIOS
over LLC protocols to transport its data. So if you add or replace a server in
your network, you may want to check the layer 3 traffic in the LAN to decide whether
you need to configure the NetBIOS/LLC protocol on the new server or not.
Example - Transfer speed of a broadband modem
If you want to check the transfer speed of a broadband modem that is attached
to a network card, use the 'Traffic per Network Card' ('Network Interface Statistics')
and add Address, KBit/s, and Max. KBit/s columns. You may add a KB or MB column
to see the amount of data that is transferred while the statistics collection is running.
Example - Network congestion
If your network or internet access is unexpectedly slow, use the 'Internet Traffic
per System and Protocol' ('L3 Addr Higher Protocol Statistics') with columns for address,
protocol, and transferred data. You will immediately see the computer and protocol that
cause the most traffic. Maybe a broadcast storm due to some misbehaving application or a
file sharing client that transfers MP3 files.
Example - Network maintenance
If computer systems in your network are often reconfigured or added, you can
check the network configuration from time to time. Maybe you removed your last
servers that used the IPX protocol and want to check whether the IPX drivers
were removed from all clients. In this case you need to use lower layer protocol
statistics. These are not visible in 'Easy Statistics Mode', so ensure that
it is switched off in the Tools menu. Now use the 'L3 Protocol Statistics'
to see if there is any IPX traffic in your network (computers with active IPX
drivers will occasionally broadcast IPX packets to find a server). If you find
IPX traffic you can either use the 'L2 Addr L3 Protocol Statistics' to find
the systems that send IPX packets or you use the 'L2 Address Statistics' and
configure
a protocol filter that hides the non-IPX traffic.
|
|