Network Protocol Analyzer
The protocol analyzer component of the MaaTec Network Analyzer does basically
the same as other protocol analyzers. It uses the promiscuous mode of the system's
network cards to collect network data and displays packet information in a
table. In this table you can select a specific network packet to get a more
detailed view of its content. So what is the difference?
Real-Time Display of Captured Network Data
 When using other protocol analyzers, you will often need to stop collecting network
data before you can see what data was captured. The MaaTec Network Analyzer
supports real-time display of the captured data. This means you can view, decode,
and filter data while the application continues to collect new packets from
the network. You can even open multiple windows that collect data from different
network cards or use different filters. For easier navigation you can switch
off the automatic scrolling of the packet list. When using other protocol analyzers, you will often need to stop collecting network
data before you can see what data was captured. The MaaTec Network Analyzer
supports real-time display of the captured data. This means you can view, decode,
and filter data while the application continues to collect new packets from
the network. You can even open multiple windows that collect data from different
network cards or use different filters. For easier navigation you can switch
off the automatic scrolling of the packet list.
Readable Decode View with Synchronized Hex Display
If you select a packet to get more information, its decoded content
will not be displayed in a usual tree view. You get all details in a clear
color-enhanced
text view that can be copied to any word processor or other application that
supports RTF text. The corresponding hexadecimal values of the decoded bytes
are displayed in a separate view on the right that scrolls together with the
decode view. You can choose between three detail levels that allow to hide
less important packet information. And for better black and white printouts
you can switch off the text coloring.
Advanced Keyboard Control
 If you quickly want to decode contiguous packets that have the same source address
or are using the same protocol, you will need to apply a view filter in most
protocol analyzers. While you can do this with the MaaTec Network Analyzer
as well, it will often be unnecessary. Just click the source address or protocol
column field of the first packet you want to decode. Now you can use the cursor
keys to navigate through the packets. If the 'MAC Src.' column of a packet
is selected, use the cursor down and up keys to jump directly to the next or
previous
packet with the same MAC source address. This works also with protocol types
and Layer 3 (e.g. IP, CLNS) addresses. Use the cursor right and left keys to
switch between table columns.
If you quickly want to decode contiguous packets that have the same source address
or are using the same protocol, you will need to apply a view filter in most
protocol analyzers. While you can do this with the MaaTec Network Analyzer
as well, it will often be unnecessary. Just click the source address or protocol
column field of the first packet you want to decode. Now you can use the cursor
keys to navigate through the packets. If the 'MAC Src.' column of a packet
is selected, use the cursor down and up keys to jump directly to the next or
previous
packet with the same MAC source address. This works also with protocol types
and Layer 3 (e.g. IP, CLNS) addresses. Use the cursor right and left keys to
switch between table columns.
Customizable Columns and Relative Time Display
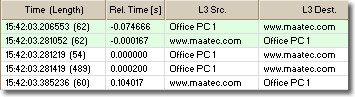 You can customize the columns of the packet list. This allows
to hide unneeded information or to add special purpose columns like lower
layer protocols or the relative packet time. The relative packet time column
allows to use any packet as time origin. Just select a packet in the packet
list and press Ctrl+0 on the keyboard. This will set the timestamp of this
packet to zero and all other packet times will be displayed relative to this
packet. Prior captured packets will have negative timestamps. You can customize the columns of the packet list. This allows
to hide unneeded information or to add special purpose columns like lower
layer protocols or the relative packet time. The relative packet time column
allows to use any packet as time origin. Just select a packet in the packet
list and press Ctrl+0 on the keyboard. This will set the timestamp of this
packet to zero and all other packet times will be displayed relative to this
packet. Prior captured packets will have negative timestamps.
Multiple Data Coloring Options
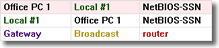 You can change the text colors for different addresses and protocols that are
displayed in the packet list. Especially the background color that can be assigned
to a protocol offers some advanced uses. It supports a kind of 'protocol inheritance'.
This means if you change the background color for TCP connect packets, this
color will be used for any protocol that uses TCP connects (e.g. HTTP and POP3)
to emphasize the connect packets. Now you can instantly see in the packet list
where a connection was initiated. Another applicability is
the differentiation between NetBIOS packets that were transported via TCP/IP
and such that were transported via the LLC protocol. You can change the text colors for different addresses and protocols that are
displayed in the packet list. Especially the background color that can be assigned
to a protocol offers some advanced uses. It supports a kind of 'protocol inheritance'.
This means if you change the background color for TCP connect packets, this
color will be used for any protocol that uses TCP connects (e.g. HTTP and POP3)
to emphasize the connect packets. Now you can instantly see in the packet list
where a connection was initiated. Another applicability is
the differentiation between NetBIOS packets that were transported via TCP/IP
and such that were transported via the LLC protocol.
Display of Packet Loss
Any protocol analyzer can lose packets if the system on which it is running is
not fast enough to process all incoming data or if other software slows down
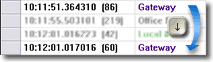
the system. If you collect network data, you will usually want to know whether
you can rely the collected data or not. While this seems to be a matter of
course, most protocol analyzers will simply drop received packets when their
buffers
are full without any notification to the user. The MaaTec Network Analyzer
displays not only whether packets were lost, you can even see where packets
were lost and how many. This way you will always know which part of the packet
list is reliable and which is not.
|